
Building a Visual Pickup Dashboard for 756 Hotel Rooms
Managing a complex 756-key multi-property inventory across Novotel, Adagio, and Mercure requires instant morning clarity. Traditional manual reporting workflows across multiple PMS exports created severe operational bottlenecks, delaying critical yield decisions.
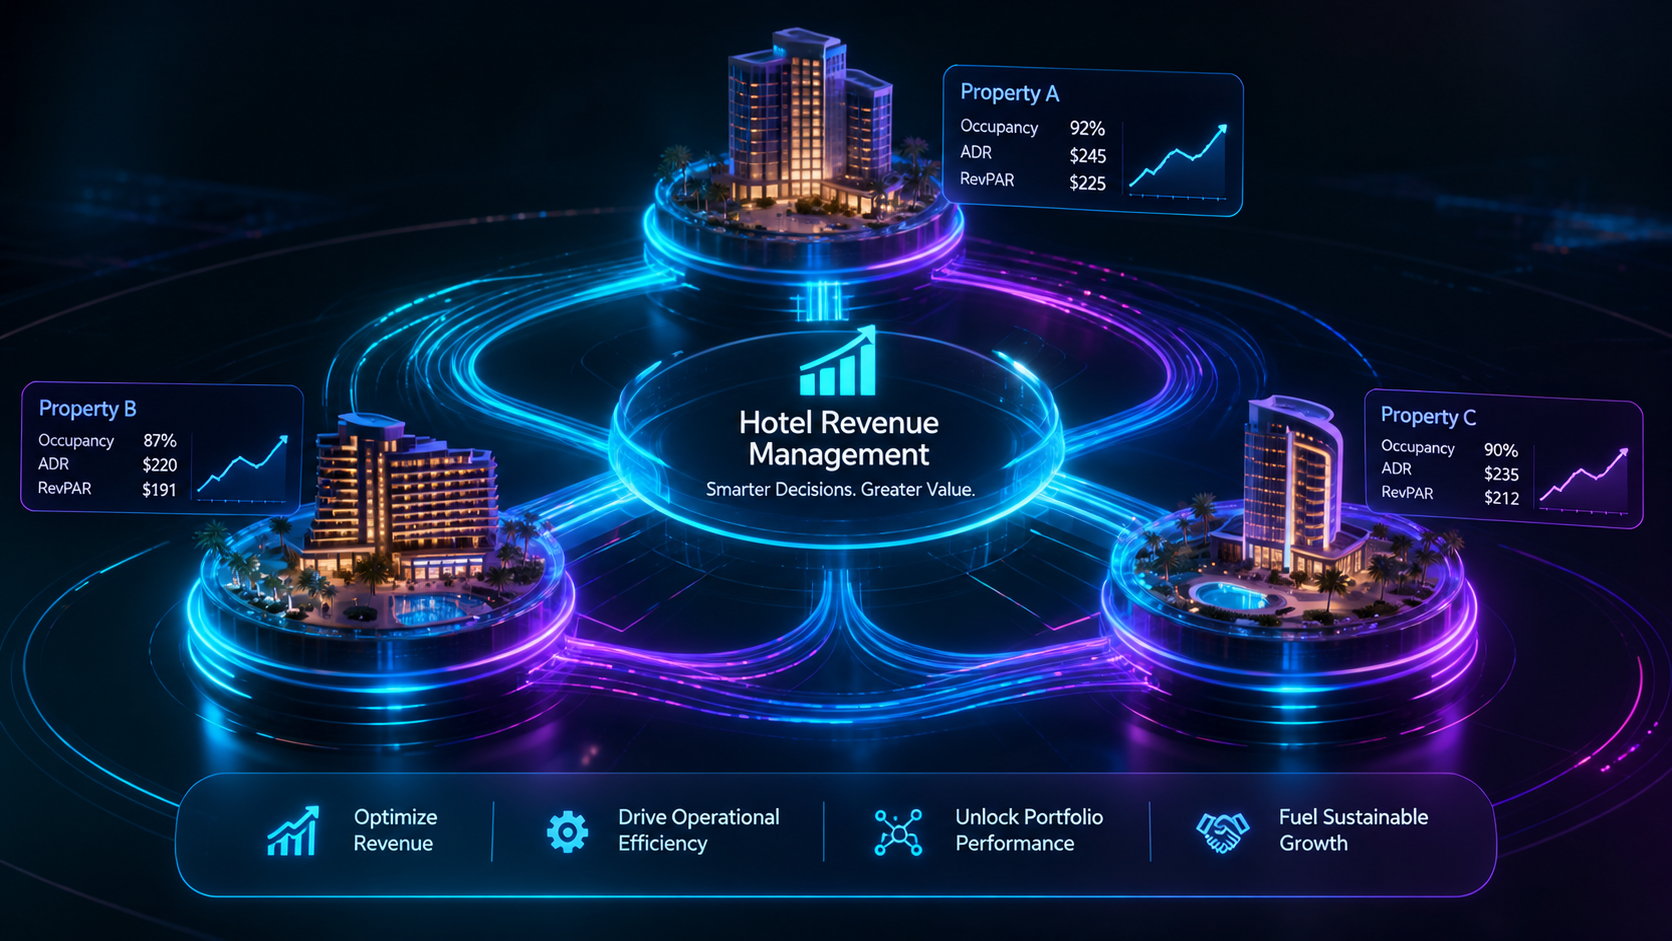
01 // The Operational Challenge & Scale
Every morning, commercial teams faced the tedious task of extracting raw text data across 3 distinct properties spanning 756 total rooms, stitching together disparate tabs, and manually calculating Day-over-Day (DoD) pickup and segment wash. This manual data wrangling consumed over 45 minutes daily per property group, introducing transcription errors and delaying pricing strategy adjustments.
In a fast-moving destination like Abu Dhabi, where compression windows can shift overnight due to major citywide conventions or leisure surges, losing nearly an hour to spreadsheet formatting means reacting after demand has already peaked. The objective was clear: eliminate the spreadsheet friction entirely without disrupting existing Property Management System (PMS) data flows.
02 // The Solution: Dynamic Excel Architecture
I engineered a centralized Excel model powered by advanced dynamic arrays (LET and SUMPRODUCT formulas). Instead of rebuilding reports from scratch, users drop raw OPERA Cloud exports into a staging tab, and the workbook instantly aggregates portfolio-wide segment wash, ADR variance, and occupancy pacing.
By leveraging lambda and filtering logic, the backend formulas automatically handle irregular row counts and missing date stamps from raw text files. This architectural resilience ensures that whether pulling reports for a full-service hotel like Novotel, an extended-stay brand like Adagio, or a lifestyle property like Mercure, the data mapping remains flawless and instantaneous.

| Segment | Rooms OTB | DoD Wash | ADR (AED) |
|---|---|---|---|
| Transient BAR | 142 | +18 | 580 |
| Corporate | 95 | +6 | 490 |
| Group Block | 110 | +34 | 420 |
| Segment | Rooms OTB | DoD Wash | ADR (AED) |
|---|---|---|---|
| Extended Stay | 104 | +12 | 450 |
| Corporate Long | 72 | +8 | 390 |
| OTA / Leisure | 48 | +15 | 360 |
| Segment | Rooms OTB | DoD Wash | ADR (AED) |
|---|---|---|---|
| Transient BAR | 72 | +12 | 420 |
| Corporate | 43 | +4 | 380 |
| Group Block | 70 | +33 | 340 |

03 // Strategic Impact & Takeaways
By standardizing the reporting pipeline across Novotel, Adagio, and Mercure, daily morning reporting prep time dropped by 75%. Commercial leadership gained immediate, error-free visibility into pace anomalies, allowing the revenue team to shift focus entirely from manual data entry to proactive yield optimization and hurdle rate adjustments.
Ultimately, this project proves that revenue optimization isn’t just about high-end RMS algorithms—it’s equally about the foundational data hygiene that feeds them. When operational friction is removed, commercial leaders can act decisively on pricing recommendations, maximizing RevPAR across every single key in the portfolio.
References & Methodological Framework
The analytics architecture and operational frameworks outlined in this case study draw upon established revenue management standards and multi-property yield methodologies:
- [1] HSMAI Revenue Management Advisory Board: Operational guidelines on agile forecasting, inventory control, and minimizing lag time in multi-property reporting cycles.
- [2] Oracle OPERA Cloud PMS Documentation: Data extraction protocols, export structuring, and automated batch report configurations for commercial analytics.
- [3] IDeaS G3 RMS Best Practices: Methodologies for tracking On-The-Books (OTB) booking velocity against Same Time Last Year (STLY) historical curves during high-compression regional events.